1. Don’t share the raw data
If you are trying to trick somebody with your data, never share the raw data; only share the conclusions. Bonus points if you can’t share the data because it is somehow priviledged or a trade secret. The last thing you want is to allow other people to evaluate your analysis and possibly challenge your conclusions.
2. Don’t share your methodology
What is the source of the data? How did you gather the data? How did you sample the data? Whatever you do, don’t share this information! If you, or your data source, made a mistake in the way the data was gathered or sampled, some pesky person might start to doubt your conclusions. Just leave this out completely, people will just assume you know what you are doing.
3. Don’t include confidence intervals
Confidence intervals are an easy to digest way to show the underlying uncertainty in your data. That is going to blunt the force of your conclusions!
Which of these sounds better?
- Simple change increased conversion 50%
- Simple change increased conversion between -12% and 96%
Your goal is to make your data sound meaningful. Present it with a false amount of certainty!
3a. If you are forced to show a confidence interval, don’t tell what it is
If you must use a confidence interval, use a low value and certainly don’t share what it is! People generally expect the confidence interval to be at least 95% (~2 standard deviations). Let’s look at this sample data:
| Conversions | Attempts | Confidence Level | Confidence Interval1 |
|---|---|---|---|
| 10 | 20 | 50% | 43% - 57% |
| 10 | 20 | 66% | 40% - 60% |
| 10 | 20 | 95% | 30% - 70% |
| 10 | 20 | 99% | 25% - 75% |
| 10 | 20 | 99.9% | 20% - 80% |
If you use a 50% confidence level, and people are expecting 95%, it is going to make your data look a lot more impressive!
4. Use lots of graphs
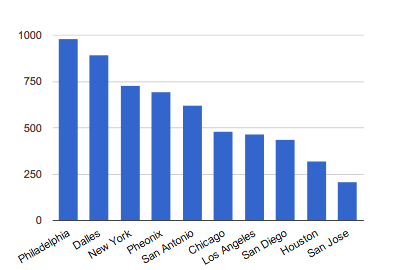
Humans love pattern matching. When you present data in a visual way, it allows people to quickly start jumping to conclusions, whether or not they are true. The above graph is just random values assigned to 10 cities in the US, then the columns are sorted. However, if you looked at the graph before I told you that, you might have already noticed multiple completely meaningless patterns.
And as an obvious extension of rule #3, never put confidence intervals in your graphs.
5. Don’t challenge your own data
You can be your own worst enemy. Sometimes your data will lead you to question aspects of your methodology or analysis. Here are some handy dos and don’ts to help guide you in these troubling situations.
Do: Do tweak your methodology until it shows the conclusion you want or you think people will believe.
Don’t: Don’t share any potential caveats with your analysis. It will just confuse your audience.
Do: Do act as if you knew the result of your analysis before you finished it. You don’t want to look like somebody who doesn’t know everything in advance.
Don’t: Don’t question the output of a regression model. It is always right.
Footnotes:
1: This is a binomial proportion confidence inverval, which is slightly different than the confidence interval for continous data. However, I think this is most relevant for the startup crowd due to the prevelance of A/B testing. The same rules apply for either. Data comes from abba, an open-source split testing calculator (disclosure: I used to work at the company where this was developed), and abba’s methodology is explained on the linked page.
Afterword
If you didn’t get the joke, I don’t recommend you do any of these things. What I do recommend is that when you are a consumer of other people’s data, you are skeptical by default and are on the lookout for these tricks and others. And if you are the person analyzing the data, show respect to your readers and give them the necessary information to confirm your conclusions.
Be especially wary when there is more of an incentive to be interesting than to be accurate. The easiest way to come up with an interesting and defensible story is with fake statistics. Fake may strike you a strong word to use, but I think it is fair. Statistics are either presented in a mathematically defensible way or they aren’t, and it really doesn’t matter if it is due to ignorance or malice.
There is a common internet phrase “pics or it didn’t happen”, which is often posted as a reply to impressive claims without evidence. While a shorthand response like this can be viewed as rude, I believe that people making impressive claims without the proper evidence is more rude. Therefore, I propose a similar phrase, raw data or it didn’t happen, as a quick response for people who make impressive analytical claims without the necessary statistical evidence.
» View discussion about this post on hacker news